Search "voice of customer analytics" and you get two categories of content: enterprise CX platforms explaining their own product, and generic "what is VoC" guides that stop at collection. Neither helps a product manager who wants to turn thousands of feedback entries into roadmap decisions without hiring a research team.
Voice of customer analytics is the discipline of analyzing collected customer feedback to surface themes, sentiment, and priority signals that feed product and experience decisions. The word that matters is analytics. Collection is Step 1. What most guides miss is that the value happens in Steps 2-4: the analysis layer, the translation to decisions, and the loop closure back to the customer.
This is a practical guide to VoC analytics built for product teams. I've been running VoC analysis at Feeqd for two years: thousands of feedback entries across widgets, boards, support tickets, and interviews. What follows is the framework, the techniques, the tools, and the AI-era shift that changes how this discipline works in 2026.
What Is Voice of Customer Analytics?
Voice of customer analytics is the systematic analysis of customer feedback data, converting unstructured text, ratings, and behavior into structured insight that drives product and customer experience decisions. It combines traditional quantitative analysis (NPS scores, CSAT trends, survey metrics) with qualitative analysis of open-ended feedback (sentiment, themes, topics, anomalies).
The analytics layer is what distinguishes VoC analytics from VoC collection. Collection gives you a pile of feedback. Analytics turns that pile into a ranked list of the top 10 themes affecting retention, or a sentiment trend that flags a new feature hurting satisfaction, or a clustering output that groups 400 feature requests into 18 distinct product areas.
VoC analytics sits between collection and action. If you have the voice of the customer process running but don't see insight patterns emerging from your feedback, the missing piece is usually this layer.
Why VoC Analytics Matters
A product team collecting feedback without an analytics layer is running blind. The feedback accumulates, but decisions remain driven by whoever communicates loudest, not by what the aggregate data says.
With analytics in place, three things change:
- Priorities become defensible. Instead of "the CEO wants X," you can point to a themed ranking with voter counts, segment breakdowns, and sentiment trends.
- Regressions are caught early. Anomaly detection flags a sentiment drop within days of a release, not in the next quarterly NPS wave.
- Retention signals surface. Themes correlated with churn become visible before they show up in the churn numbers, giving you weeks of lead time. See track feedback impact for the measurement side.
Teams that build this layer report faster roadmap cycles and higher feature adoption among acted-on requests. Teams that skip it accumulate debt in the form of ignored feedback and disengaged users who stop submitting.
VoC Analytics vs VoC Listening: The Distinction That Matters
Most online content treats "listening" and "analytics" as synonyms. They are not.
VoC listening is collection: setting up channels, capturing feedback, storing it. The output is a feedback repository.
VoC analytics is what happens next: applying quantitative and qualitative methods to that repository so themes, trends, and priorities become visible. The output is an insight report or a ranked decision shortlist.
| Dimension | VoC Listening | VoC Analytics |
|---|---|---|
| Input | Customer channels (surveys, widget, support) | Structured + unstructured feedback data |
| Activity | Capture, store, tag at entry | Cluster, classify, score, trend, anomaly-detect |
| Output | Feedback repository | Insights, themes, priority list |
| Who does it | Support, sales, PM (collectors) | PM, researcher, data analyst, or AI |
| Cadence | Continuous | Weekly to monthly batch analysis |
| Tooling | Widget, boards, CRM tagging | NLP platforms, spreadsheets, LLMs |
A team with VoC listening but no analytics has a growing pile of feedback nobody reads. A team with analytics but no structured listening has clean outputs from an incomplete input. Both layers are needed, but product teams usually have listening infrastructure and a weak analytics muscle. This guide focuses on closing that gap.
The 4 Layers of VoC Analytics
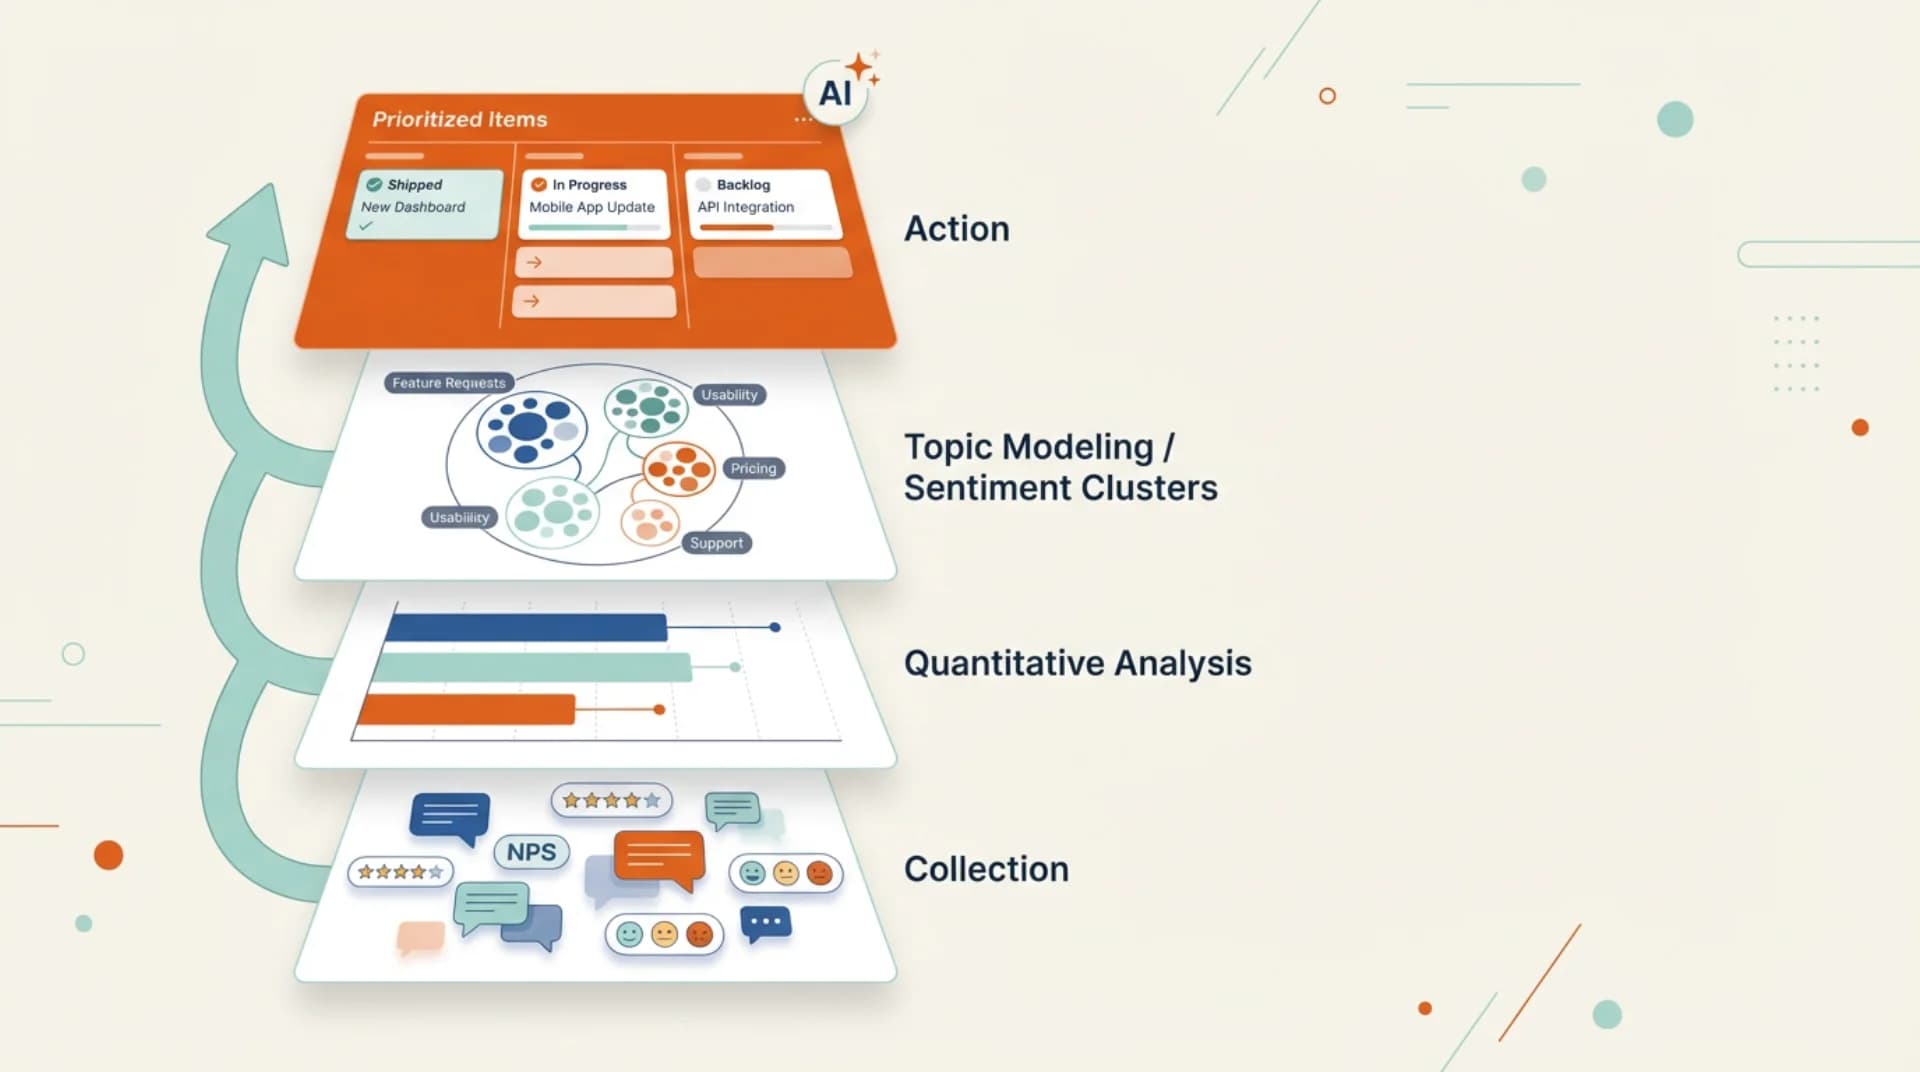
Think of VoC analytics as four stacked layers. Each layer produces an output the next one consumes.
Layer 1: Collection normalization Feedback arrives in many shapes: widget submissions with context, support tickets with customer IDs, sales call notes as free text, survey responses with scores. The first analytics job is normalization: a common schema with fields for customer ID, segment, channel, timestamp, content, optional sentiment, optional tags. Without normalization, every downstream analysis becomes ad hoc.
Layer 2: Quantitative analysis Trends you can count: NPS over time, CSAT by segment, feedback volume by channel, response rates, status distribution on a feedback board. This layer is well-served by standard BI tools.
Layer 3: Qualitative analysis The hard layer. Taking thousands of open-ended responses and converting them to structured signal: sentiment, topics, themes, clusters. This is where NLP and LLMs operate. Traditional approaches use libraries like spaCy or vendor platforms like Lexalytics. Modern approaches use LLMs to cluster and summarize in one pass.
Layer 4: Action synthesis Converting analysis output to product decisions: priority rankings, roadmap candidates, segment-specific recommendations, retention risk flags. This is the step most content skips. Without it, you have pretty analysis nobody acts on. See how to use customer feedback for product roadmap for the operational mechanics of this step.
Each layer depends on the previous one. Skipping Layer 1 (no normalization) makes Layer 3 analyses unreliable. Skipping Layer 4 wastes everything above it.
Core VoC Analytics Techniques
These are the techniques that actually turn raw feedback into insight. You don't need a PhD in NLP to apply them, but you do need to know what each one does and when to use it. For the collection side of the stack (surveys, interviews, voting boards, widgets), see our guide on voice of customer techniques; this section focuses on the analytical layer that runs downstream.
Sentiment analysis
Classifies feedback as positive, negative, or neutral (sometimes more granular: very positive, mixed, etc.). Useful for tracking satisfaction trends over time and flagging sentiment drops after a release.
When it works: large volume of text, general direction is the question. "Is sentiment improving after our pricing change?"
When it fails: sarcasm, domain-specific language, short text. "Sure, that feature is great" flagged as positive when it's sarcastic.
Topic modeling and theme extraction
Groups feedback by underlying topic without predefined categories. Classical approaches: LDA, NMF. Modern approach: LLMs with clustering prompts. Produces a list of themes and the number of feedback items per theme.
When it works: you have hundreds or thousands of feedback items and want to see structure emerge without imposing your own categories.
When it fails: small samples (under ~100 items), or when your product area is narrow and everything clusters into one topic.
Feedback clustering
Groups similar feedback items even when they use different words. "Add Slack integration" and "sync to Slack" belong in one cluster. Embedding-based clustering (using text embeddings from a model like OpenAI's or Voyage's) is now standard.
When it works: deduplicating feature requests, merging similar bug reports, quantifying aggregate demand across phrasings.
When it fails: when similarity in embeddings hides meaningful distinctions. "Dark mode on mobile" and "dark mode on desktop" might cluster together but are different product scopes.
Sentiment-weighted prioritization
Combines volume (how many asked) with sentiment (how strongly) to rank themes. A theme mentioned by 50 users with high negative sentiment outranks a theme mentioned by 200 users with neutral sentiment.
When it works: prioritizing churn-risk signals over volume-only requests. See prioritize feature requests for scoring frameworks that combine these signals.
When it fails: small samples where one angry user skews the average.
Anomaly detection
Flags sudden changes in feedback patterns: a spike in negative sentiment, a new theme appearing suddenly, a CSAT drop in a specific segment. Useful for catching regressions fast.
When it works: you have enough historical data to establish baselines (usually 6+ months).
When it fails: seasonal products, very low feedback volume, or rolling-out products where everything is a new pattern.
Cohort and segment analysis
Analyzes feedback by customer segment: plan, industry, geography, tenure. Reveals that a theme is actually Enterprise-only or that Free-tier users complain about different things than paid.
When it works: you have segment metadata attached to every feedback item (Layer 1 normalization paying off).
When it fails: segmentation isn't captured at intake, forcing reconstruction from CRM joins.
VoC Analytics for Product Teams (Not Enterprise CX)
Most VoC analytics content assumes you have Qualtrics, Medallia, or Salesforce Service Cloud, plus a research team to run it. That framing doesn't fit product teams at startups or scale-ups. Here's what changes:
| Dimension | Enterprise CX VoC Analytics | Product Team VoC Analytics |
|---|---|---|
| Primary data source | Survey waves (NPS, CSAT, transactional) | Feedback boards, widget submissions, support tags |
| Sample sizes | Thousands per quarter | Dozens to hundreds weekly |
| Analysis cadence | Quarterly deep-dive reports | Weekly triage, monthly prioritization |
| Team | Dedicated VoC/CX research function | PM runs it with occasional analyst help |
| Tools | Medallia, Qualtrics, Lexalytics ($50K-$500K/yr) | Feedback board + spreadsheet + LLM API |
| Output | Strategic insights, CX roadmap | Feature priority list, roadmap candidates |
| Success metric | NPS/CSAT lift over 6-12 months | Feature adoption, retention, feedback loop closure |
Product team VoC analytics is lean, continuous, and tightly coupled to the product roadmap. You don't need a 6-figure platform. You need a normalized feedback repository, an LLM API for qualitative analysis, and a monthly prioritization ritual. The "always-on" framing is covered in depth in how to build a continuous feedback loop.
The AI-Era Shift: LLMs Change VoC Analytics
The biggest change in VoC analytics between 2023 and 2026 is the collapse of the analysis cost curve. Work that required a trained NLP pipeline or a $50K platform now runs as a single LLM prompt over a CSV of feedback.
What LLMs changed specifically:
-
Theme extraction from open-ended feedback. Previously required topic modeling expertise. Now: "Cluster these 400 feedback items into distinct themes, return theme name + count + example quotes." Takes 30 seconds.
-
Sentiment with domain context. Classical sentiment models miss product-specific nuance. LLMs with a product description in the prompt understand that "finally fixed" is positive even though "finally" skews classical models.
-
Feedback summarization at scale. Turn 200 support tickets into a two-paragraph executive summary with representative quotes and ranked themes. Weekly.
-
Query-driven analysis. Ask natural language questions of your feedback: "What are enterprise users asking for that free users aren't?" "Which features had the most negative feedback last month?"
The caveat: LLMs are unreliable for precise numbers. They hallucinate counts, misattribute sentiment in edge cases, and weight recent examples over older ones. Use them for qualitative synthesis and verification, not as your source of truth for numeric reports.
Practical 2026 setup for product teams: a feedback repository with structured export, an LLM API (Claude or GPT) called weekly with a standardized prompt, and a human reviewer who validates outputs. Cost under $50/month for most product teams. Outcome equivalent to a junior analyst running VoC weekly. For the operational mechanics of feeding this output into shipping, see how to implement user feedback into product development.
From Analysis to Decision: Closing the Bridge
Analysis that doesn't drive decisions is an expensive hobby. The bridge from insight to action is where most VoC programs break down.
A working bridge has three parts:
1. A priority synthesis step
Don't dump analysis output into a report and hope someone reads it. Force yourself to produce a weekly shortlist:
- Top 3 themes by combined volume + sentiment weight
- Top 1 anomaly worth investigating
- Top 3 feature candidates for the roadmap
This shortlist is the unit of action. Everything else is reference material.
2. A decision ritual
The shortlist needs a place to be acted on. A weekly 30-minute product review where the PM walks through it, the team decides what to build or defer, and outcomes are logged.
3. A loop closure step
Decisions flow back to customers. Users who submitted feedback that drove a decision get notified: "You requested X, here's the status." Features that ship reference the voting data that drove them. Read how to close the feedback loop for the mechanics.
Without all three parts, VoC analytics becomes shelfware. With them, it becomes the most reliable input to your product roadmap.
VoC Analytics Tools Comparison
The tool space divides into four categories, each serving different team sizes and budgets. For a deeper tier-by-tier breakdown across 13 tools with pricing transparency, see our dedicated guide on voice of customer software.
| Category | Tools | Best for | Typical cost |
|---|---|---|---|
| Enterprise CX platforms | Qualtrics, Medallia, Salesforce Service Cloud | Enterprise CX teams with dedicated researchers | $50K-$500K/yr |
| AI-native VoC analytics | Enterpret, Chattermill, Viable | Mid-market product teams wanting pre-built NLP | $15K-$60K/yr |
| Feedback-first tools with analytics | Feeqd, Canny, UserVoice, Productboard | Product teams wanting collection + basic analytics in one | $19-$499/mo |
| DIY with LLMs | Spreadsheets + OpenAI/Claude API + feedback repo | Startups and lean teams | $20-$100/mo |
How to choose:
- Under 100 feedback items/month and budget tight: DIY with LLMs. Export feedback weekly, prompt an LLM for themes, act.
- 100-500 items/month and you want faster iteration: feedback-first tool (Canny, Feeqd, Productboard) with voting and status workflows built in.
- 500+ items/month across many channels: AI-native VoC platform (Enterpret, Chattermill) to automate the analytics layer.
- Enterprise CX program with quarterly waves and dedicated team: Medallia or Qualtrics.
The mistake most teams make: starting at the enterprise tier because "that's what VoC tools look like." Start at DIY, move up only when you hit the limit.
Common VoC Analytics Mistakes
Treating analytics as reports, not decisions. The output of VoC analytics should be a decision shortlist, not a dashboard that nobody opens. Every analysis run should end with "therefore we're doing X."
Analyzing without normalization. If your feedback items don't have consistent metadata (segment, channel, timestamp), you can't run segment-level analysis. Fix Layer 1 before worrying about Layer 3.
Over-trusting sentiment scores. Sentiment analysis is directionally useful but often wrong on individual items. Treat it as a signal, not a verdict. Read a sample of items in any category before acting.
Ignoring the silent majority. Loud users are overrepresented in feedback data. Complement VoC analytics with usage analytics: what do users do vs what do they say. A feature with low complaint volume but low usage is failing quietly.
Skipping the loop closure. If customers don't see what happened to their feedback, they stop giving it. Analytics without loop closure creates a declining data pipeline.
Building for enterprise analyst workflows when you're a 10-person product team. Copy the approach that fits your scale, not the process documented by Qualtrics for F500 companies.
FAQ
What is a voice of customer analysis?
A voice of customer analysis is the systematic evaluation of collected customer feedback to surface themes, sentiment, priorities, and anomalies that inform product or experience decisions. It combines quantitative metrics (NPS trends, CSAT by segment) with qualitative analysis of open-ended feedback (sentiment, topics, clusters). The output is an insight shortlist or a ranked list of recommended actions, not a raw feedback dump.
What does a voice of the customer analyst do?
A voice of the customer analyst is responsible for converting customer feedback into structured insights the business can act on. Typical responsibilities: designing feedback collection flows, running sentiment and theme analysis on open-ended data, producing weekly or monthly insight reports, collaborating with product and CX teams on prioritization, and tracking the downstream impact of acted-on feedback (adoption, retention, satisfaction lift). In product teams, this role is often a responsibility of the product manager rather than a dedicated hire.
What is the difference between CSAT and VoC?
CSAT is a single metric: customer satisfaction, usually from a survey score on a 1-5 or 1-10 scale. VoC (voice of the customer) is a broader program that captures customer input across all channels and converts it into action. CSAT is one input to VoC, not a replacement for it. A strong VoC program tracks CSAT as one signal alongside feedback volume, sentiment trends, theme distributions, and retention metrics.
What is VoC in Six Sigma?
In Six Sigma, Voice of the Customer is the method for capturing customer requirements during the Define phase of DMAIC (Define, Measure, Analyze, Improve, Control). It involves translating customer needs into Critical-to-Quality characteristics (CTQs) that feed process improvement. Outside Six Sigma, VoC has been adopted by product, CX, and research teams as a broader program for collecting and acting on customer input. The Six Sigma framing emphasizes process alignment; the product team framing emphasizes roadmap alignment.
How do you measure VoC analytics success?
Measure VoC analytics by its downstream impact, not by the volume of analysis produced. Key metrics: percentage of themes surfaced by VoC that end up as roadmap items (target above 30%), time from feedback submission to status update visible to the customer (target under 30 days), percentage of customers who voted for shipped features who saw a direct notification (target above 80%), and retention or satisfaction lift among customers whose feedback was acted on. Dashboards without these impact metrics are vanity metrics.
Get started with Feeqd for free
Let your users tell you exactly what to build next
Collect feedback, let users vote, and ship what actually matters. All in one simple tool that takes minutes to set up.
Sign up for free